CS 563
Advanced Topics in
Computer Graphics
Virtual Gonioreflectometry
Guy Mann
 A gonioreflectometer
measures the reflectance properties of a material. It is a physical method which bounces light
off of the surface of a sample and detects the light which reflects off the
sample. The hardware required for this
is at once prohibitively expensive and requires a physical sample of the
material which is not
A gonioreflectometer
measures the reflectance properties of a material. It is a physical method which bounces light
off of the surface of a sample and detects the light which reflects off the
sample. The hardware required for this
is at once prohibitively expensive and requires a physical sample of the
material which is not 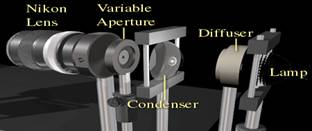 always
feasible for computer generated objects.
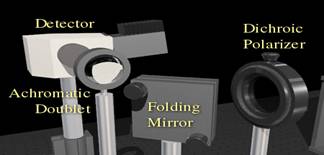
The physical setup of the gonioreflectometer consists of a light source, an object
being measured and a detector. To
perform the measurement a defined amount of light is emitted at the
object. Light interacts with the surface
and is measured after its interaction with the object. BRDF is determined from the amount and
wavelengths of light detected after the interaction.
always
feasible for computer generated objects.
The physical setup of the gonioreflectometer consists of a light source, an object
being measured and a detector. To
perform the measurement a defined amount of light is emitted at the
object. Light interacts with the surface
and is measured after its interaction with the object. BRDF is determined from the amount and
wavelengths of light detected after the interaction.
The goal of virtual gonioreflectometry is to simulate the
reflectance properties of materials without a physical sample by using
geometric approximation at the milli- and micro- scale. Sub-scale information is used to simulate the
BRDF of a material by creating geometry at a small scale to mimic the
understood behavior of the light which 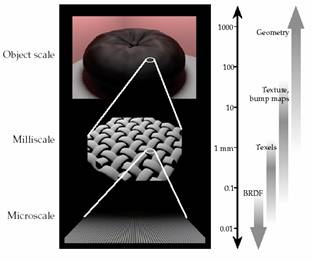 interacts with the material which is being modeled. So with sub-scale geometry the light interaction
with the small scale geometry is measured and then this information is used as
the BRDF for the next larger scale. This
simulates the interactions of
gonioreflectometry; for a given geometry.
interacts with the material which is being modeled. So with sub-scale geometry the light interaction
with the small scale geometry is measured and then this information is used as
the BRDF for the next larger scale. This
simulates the interactions of
gonioreflectometry; for a given geometry.
In virtual gonioreflectometry
all the pieces of the physical setup have analogies. Light is distributed using a Monte Carlo Raytracing approximation.
Objects are represented with polygons in the usual way. The detector is analogous to the method in
which the BRDF which is created is stored.
The two methods I discuss for measuring and storing the reflected light
information from the geometry are Capture Spheres and Spherical Harmonics.
Before we go into detail the methods for capturing and storing the
reflectance data a more detailed explanation of the overall process of gonioreflectometry.
If we say we can store the information of light reflectance which is
gained from a set of geometry then all we require to create a BRDF for an
object is an understanding of the 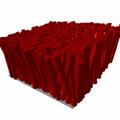
 geometry of its material. With a model of the material we can measure
learn the reflectance properties of the materials geometry. Then we can apply these reflectance
properties to the object scale geometry as its material properties or
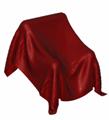
BRDF. A good example of this is a model of
a velvet chair [6]. The object’s
material was defined by the output BRDF of a model of cylinders. A square patch of cylinders was created which
bent at various angles. This model
represented the velvet material and can be referred to as the micro-geometry of
the object. Once the reflectance of the
micro-geometry was measured this information was applied to the object and a
picture was created which looked very much like a velvet chair. Using this technique, we can create arbitrarily
complex BRDFs by modelling
the surface microgeometry and then passing it to the
virtual gonioreflectometer.
geometry of its material. With a model of the material we can measure
learn the reflectance properties of the materials geometry. Then we can apply these reflectance
properties to the object scale geometry as its material properties or
BRDF. A good example of this is a model of
a velvet chair [6]. The object’s
material was defined by the output BRDF of a model of cylinders. A square patch of cylinders was created which
bent at various angles. This model
represented the velvet material and can be referred to as the micro-geometry of
the object. Once the reflectance of the
micro-geometry was measured this information was applied to the object and a
picture was created which looked very much like a velvet chair. Using this technique, we can create arbitrarily
complex BRDFs by modelling
the surface microgeometry and then passing it to the
virtual gonioreflectometer.
Now
that we understand what is done with the BRDF once it has been captured we can
go into some depth on how we obtain this BRDF from the micro-geometry. Spherical Harmonics uses the polar coordinate
system to create a function which defines the direction of all possible rays of
light exitant from the geometry for any incident ray.
Reflectance information from
the micro-geometry is stored by using a spherical harmonic function to define
the approximate ray 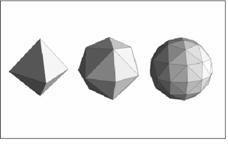 scattering. The second method is called a capture
sphere. Capture spheres define a tree, representing facets of
a geodesic sphere, which store the ray scattering information from the
micro-geometry. Each facet of the sphere
is used as a bin to store the ratio of the exitant to
incident flux density, also known as the spectral flux density. The geodesic
spheres are created dynamically and its facets subdivide when needed
scattering. The second method is called a capture
sphere. Capture spheres define a tree, representing facets of
a geodesic sphere, which store the ray scattering information from the
micro-geometry. Each facet of the sphere
is used as a bin to store the ratio of the exitant to
incident flux density, also known as the spectral flux density. The geodesic
spheres are created dynamically and its facets subdivide when needed
. The 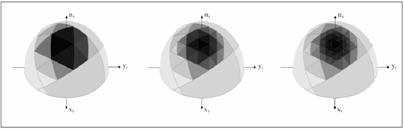 subdivision of the facets of the capture sphere is based on
the root mean squared deviation at each wavelength for the spectral flux
density of each possible sub-facet of a facet.
This means that when a packet is tested for subdivision it is broken up
into its 4 possible sub-facets and each of these is tested for its spectral
flux density, meaning how much light is reflecting off the geometry and passing
through that facet of the geodesic. If
the root mean squared deviation is above a small tolerance then the facet is
subdivided. This allows the capture sphere
to store a great deal of information about the locations at which the light
will reflect from the surface material defined by the micro-geometry.
subdivision of the facets of the capture sphere is based on
the root mean squared deviation at each wavelength for the spectral flux
density of each possible sub-facet of a facet.
This means that when a packet is tested for subdivision it is broken up
into its 4 possible sub-facets and each of these is tested for its spectral
flux density, meaning how much light is reflecting off the geometry and passing
through that facet of the geodesic. If
the root mean squared deviation is above a small tolerance then the facet is
subdivided. This allows the capture sphere
to store a great deal of information about the locations at which the light
will reflect from the surface material defined by the micro-geometry.
References
1.Westin S. H., J.R. Arvo, K.E.
Torrance, “Predicting Reflectance Functions from Complex Surfaces”, Proc. ACM
SIGGRAPH 1992
2.Gondek J.S., Meyer, G.W., and Newman J.G, “Wavelength Dependent
Reflectance Functions”, Proc. ACM SIGGRAPH 1994
3.Cabral B. et al, “Bidirectional Reflection Functions from Surface
Bump Maps”, Proc. ACM SIGGRAPH 1987, pp 273-281
4.Meyer G W et al, “A Computer Graphics System for Rendering Gonio-Apparent Colors”, Proc. AIC Congress 2001
5.Cornell University Program of Computer Graphics, Cornell Gonioreflectometer, [Online],
Available: http://www.graphics.cornell.edu/research/measure/gonio.html
[February 2003]
6.Imager Computer Graphics Laboratory, The Main Image Gallery, [Online] Available: http://www.cs.ubc.ca/nest/imager/contributions/bobl/imagergallery/main/top.html, [February 2003]