Glyph Placement for Effective Information Display
by Matthew O. Ward
ABSTRACT
The location of graphical entities such as data points, glyphs, or icons
in a display can be used to convey significant information about the relations
between entities. The placement problem manifests itself in many areas,
including data visualization, information visualization, and screen layout,
and many strategies have been developed in each domain. The goal of this
talk is to identify and unite a variety of placement techniques from
different disciplines, correlate techniques with implicit and explicit relations
within the entities being visualized, and suggest new methods for placement and
interaction with the resulting entities. I will focus on the placement of
glyphs, which are graphical entities whose visual attributes are controlled by
different fields of multivariate data points. However, many of the results
are pertinent to the placement of icons and data points as well.
ENTITY RELATIONSHIPS
An entity is a data object consisting of a set of attributes, each of which
may be of a nominal or ordinal type.
Entities to be placed on a screen may or may not have quantifiable relations
with each other. At a minimum, we can use the order of the entities in the
file or database as an implicit linear order. Other linear orders may be
derived by sorting the entities based
on one or more attributes. Hierarchical ordering relations can be
explicit, as in organizational charts or directory structures, or derived, such
as by using clustering or partitioning algorithms. A relation which is perhaps
more powerful than ordering is that of a distance or similarity metric. For M
entities this would be specified as an M by M matrix, with entries indicating
a degree of similarity or difference between pairs of entities. A wide range
of algorithms exist for computing these similarity/difference metrics, and
varying the algorithms can produce very distinct matrices.
COMMON TECHNIQUES
The most common strategy for glyph placement is either to divide the screen
into M roughly equal sized regions and assign each glyph to a successive slot
based on some ordering [Ward94] or use two numeric attributes of the glyph to
determine a position. The former technique, while making effective use of
screen space, may fail to convey relationships other than linear ordering. The
latter technique can display more extensive relationships, but may suffer from
occlusions and poor space utilization.
Below are some examples of existing methods for glyph/data placement, using
the well-known IRIS data set. This data has 4 dimensions: petal length, petal
width, cepal length, and cepal width. The data covers 3 varieties of iris,
with some separation between varieties. The first example shows the
IRIS data in the original order it was stored, using XmdvTool.
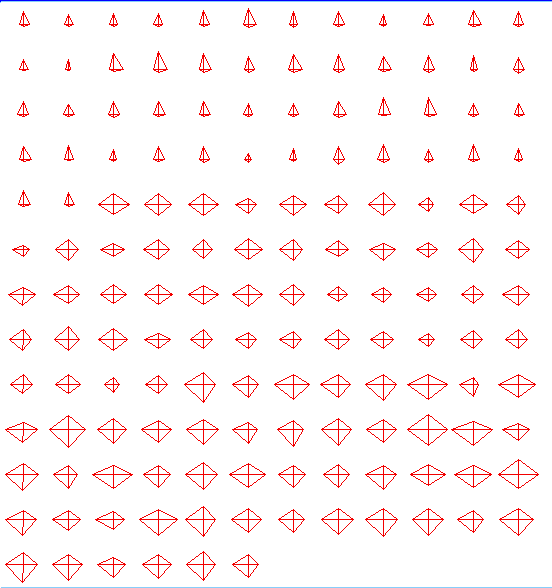
In this figure, the IRIS data is sorted by sepal length.
Here I use a scatterplot to show the IRIS data, with position based on 2
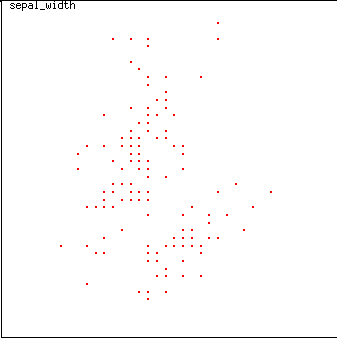
dimensions (sepal length vs. sepal width), using XmdvTool.
SOME CRITERIA FOR GOOD PLACEMENT
A major criterion for effectively conveying information graphically is that
distortion of the actual information is minimized. Thus not only should the
viewer be able to infer correct relational information (semantically similar
entities should be placed near each other on the screen), but false relations
(entities which are near on the screen, but not semantically close) should not
be presented. Another issue is the effect of occluding entities; in most
situations we would like to perceive each entity individually, which dictates
against occlusion. Finally, we want to make effective use of the empty space
on the screen; too much empty space may be an indication that not enough space
is being allocated for glyph display, while not enough empty space may make
relations, especially those involving clustering, difficult to perceive.
SOME IMPROVED PLACEMENT TECHNIQUES
For linearly ordered entities, there are several methods to convey more
information using placement. VisDB [Keim94] uses a circular arrangement of
sorted colored entities, with successive similar entities forming rings in the
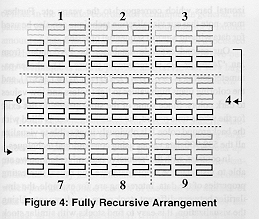
display. Similarly, the Recursive Pattern technique [Keim95] uses recursively
defined raster sweeps of smaller and smaller regions, so that entities near
each other in order are close to each other on the screen (this is related to
space-filling curves). This technique may be extensible to handle
hierarchically ordered entities as well. Hierarchically ordered entities can
also be displayed using tree-maps [Johnson91], which partition space either
vertically or horizontally in a recursive, alternating fashion. Another
popular hierarchical technique is cone trees [Robertson91], which are 3-D
trees with branches
emanating in a circular fashion from parent nodes. This might be effective
in the display of 3-D glyphs.
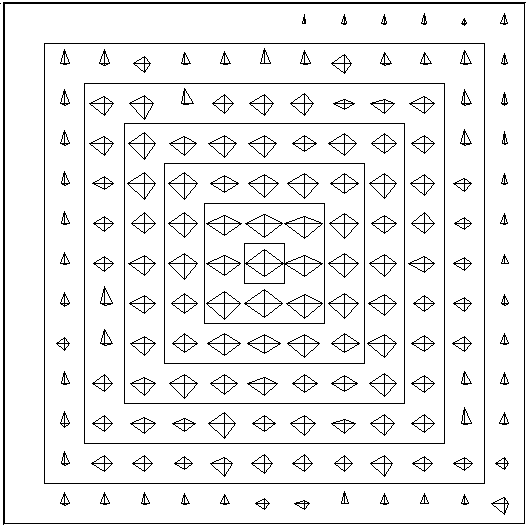
Some possible filling patterns for linear ordered glyphs, based on VisDB.
A recursive filling pattern, scanned from [Keim95].
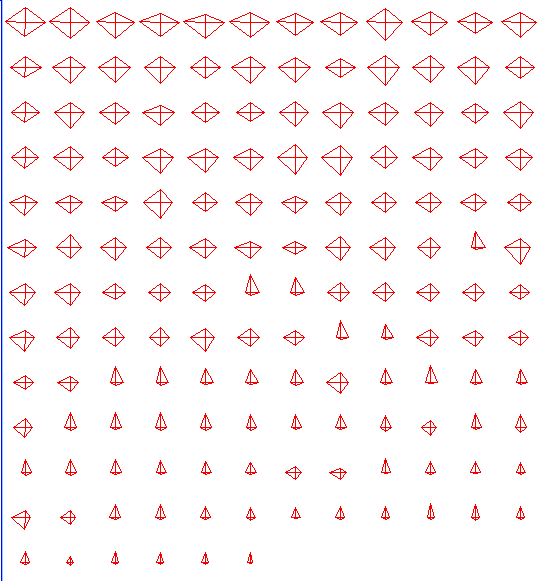
In this figure, the IRIS data is sorted by sepal length and positioned in
a spiral pattern, as in VisDB.
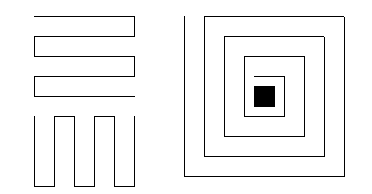
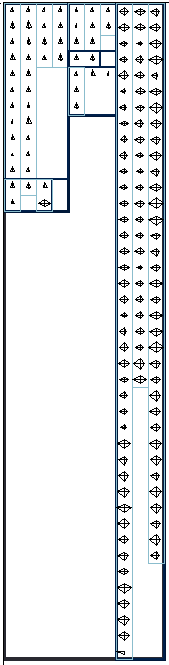
The IRIS data in hierarchical placement, partitioned using DySect [Andreae]
and drawn
using a new plotting program
based on tree-maps. The method recursively
divides space based on the size of membership in partitions and
subpartitions, alternating
horizontal and vertical orientation. The width and intensity of the
boundaries show different levels of partitioning.
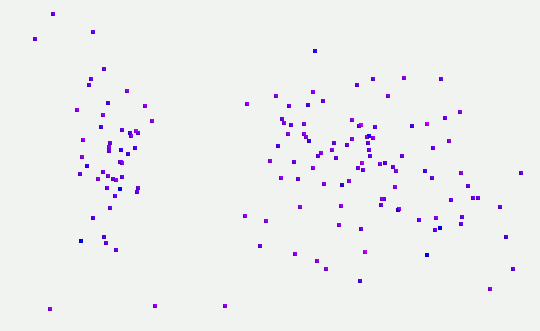
Entities with distance/similarity relationships can be placed using
dimensionality reduction techniques such as multidimensional scaling [Bentley96]
or principal components analysis. Another strategy is to perform clustering on
the entities and use either a space partitioning algorithm such as tree-maps or
a spring model to force separation between clusters while encouraging bonding
within clusters.
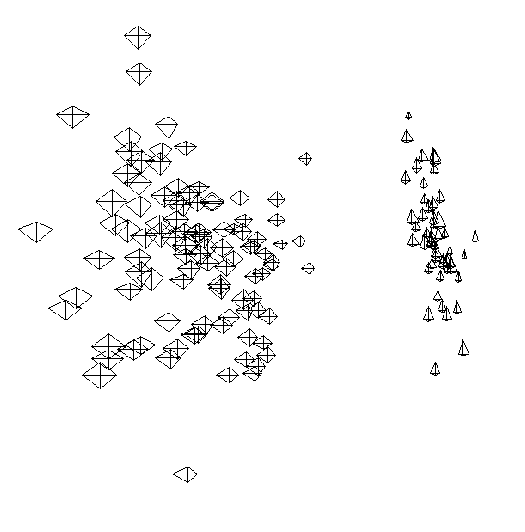
Here the IRIS data is plotted using multidimensional scaling, using MAVIS.
Here the IRIS data is plotted using principal components analysis, using
XmdvTool (experimental).
INTERACTIVE AND AUTOMATIC TECHNIQUES FOR DISPLAY ENHANCEMENT
There are many strategies one could use to improve the interpretability of the
resulting entity placement [Ingram95]. To reduce occlusion we can apply a
jitter algorithm or use a spring model to force separation. To eliminate
clutter, entities can be manually deleted, made translucent, or moved to a
designated ``uninteresting'' area. Finally, groups of related entities can be
merged
into ``mega-entities'', which can be automatically unmerged when the user zooms
into a particular region of the data space.
SUMMARY
In this talk I've attempted to describe a broad spectrum of techniques for
placing glyphs on a display, using the relationships explicit or implicit in
the data to determine appropriate placement strategies. Future work will
include implementing a single environment for experimenting with glyph
placement and performing user studies to gauge the effectiveness of the various
placement strategies and enhancement techniques.
REFERENCES
Andreae, P., Dawkins, B., and O'Connor, P., ``DySect: an incremental clustering
algorithm,'' document included with public-domain version of the software,
retrieved from http://lib.stat.cmu.edu/general/dysect.
Bentley, C.L., and Ward, M.O., ``Animating multidimensional scaling to
visualize n-dimensional data sets,'' IEEE Information Visualization '96,
pp. 72-73, October, 1996.
Ingram, R. and Benford, S., ``Legibility enhancement for information
visualization,'' IEEE Visualization '95, pp. 209-216, October, 1995.
Johnson, B. and Shneiderman, B., ``Tree-maps: a space-filling approach to
the visualization of hierarchical information structures, IEEE Visualization
'91, pp. 189-194, October, 1991.
Keim, D.A., and Kriegel, H.-P., ``VisDB: database exploration using
multidimensional visualization'', Computer Graphics and Applications, pp.40-49,
September, 1994.
Keim, D.A., Kriegel, H.-P., and Ankerst, M., ``Recursive pattern: a technique
for visualizing very large amounts of data,'' IEEE Visualization '95, pp.
279-286, October, 1995.
Robertson, G., Card, S., and Mackinlay, J., ``Cone Trees: animated 3D
visualizations of hierarchical information,'' Proc. of CHI '91, pp. 189-194,
1991.
Ward, M.O., ``XmdvTool: integrating multiple methods for visualizing
multivariate data,'' IEEE Visualization '94, pp. 326-333, October, 1994.
![[Return to CS563 '97 talks list]](/images/back.gif)
matt@owl.WPI.EDU